Sold data from October 2022 to October 2026, per Pillar 9 / CREB sales records, as of 8 October 2026.
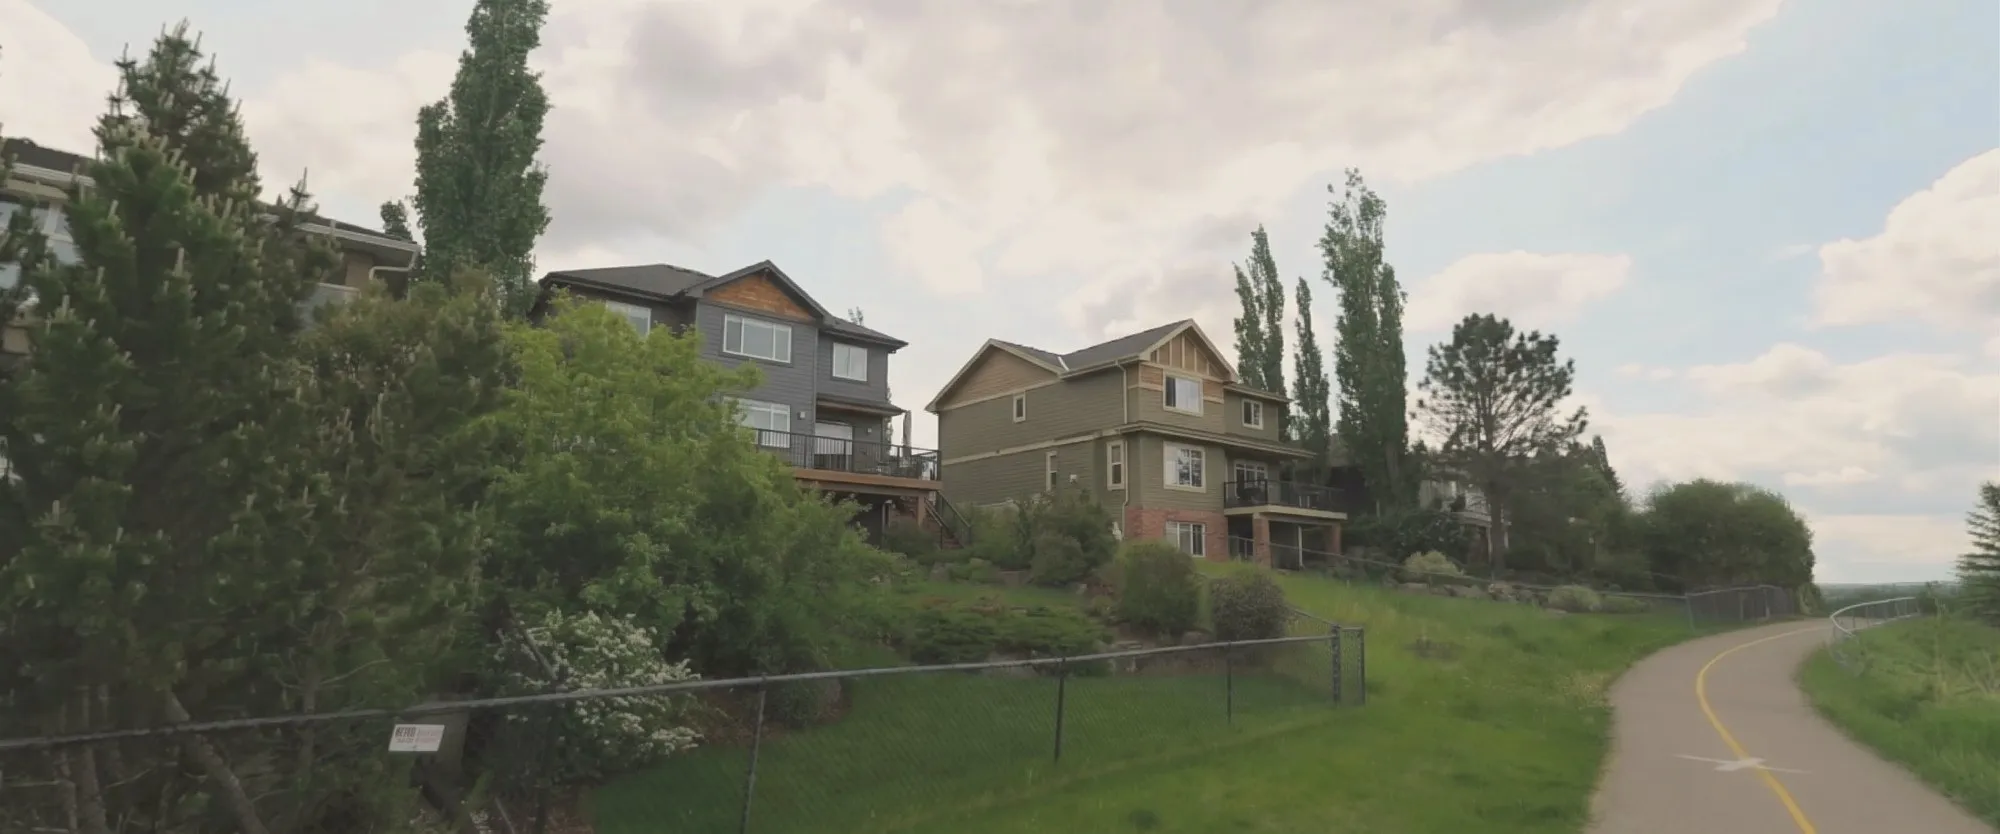
Backing onto a park adds about 4% to the price of a Calgary home. A view adds 3% to 15%, by the metre of drop behind the house. Those numbers come from 55,493 detached and semi-detached sales, each one pinned to its city lot and compared with the same home on an ordinary lot in the same community, sold in the same year.
I built this because comparable sales get chosen by distance and size, and the park or the ridge behind the fence gets a round-number guess at the end. The guess is wrong in both directions, and it is not a rare case: one Calgary home in ten backs onto green space, one in twenty-five has a view.
The short version
- A golf course behind the fence adds about 13%. A regional park about 12%. A natural area about 5%.
- A neighbourhood park adds about 4%. A park or school field about 3%. A pathway on its own adds nothing.
- A view adds about 3% at an 8 to 12 metre drop and about 15% at 30 metres or more.
- Green space across the street adds about 1.6%.
- A lake lot adds about 74%, but the house on it is rarely ordinary, so part of that is the house, not the water.
- Road noise costs 2% to 10%, has for four years, and is already in the price.
What is backing onto a park worth?
Backing onto a park adds about 4% to the price, and what sits past the fence decides whether it is more or less than that. Big and natural pays. A strip of grass with a path on it does not.
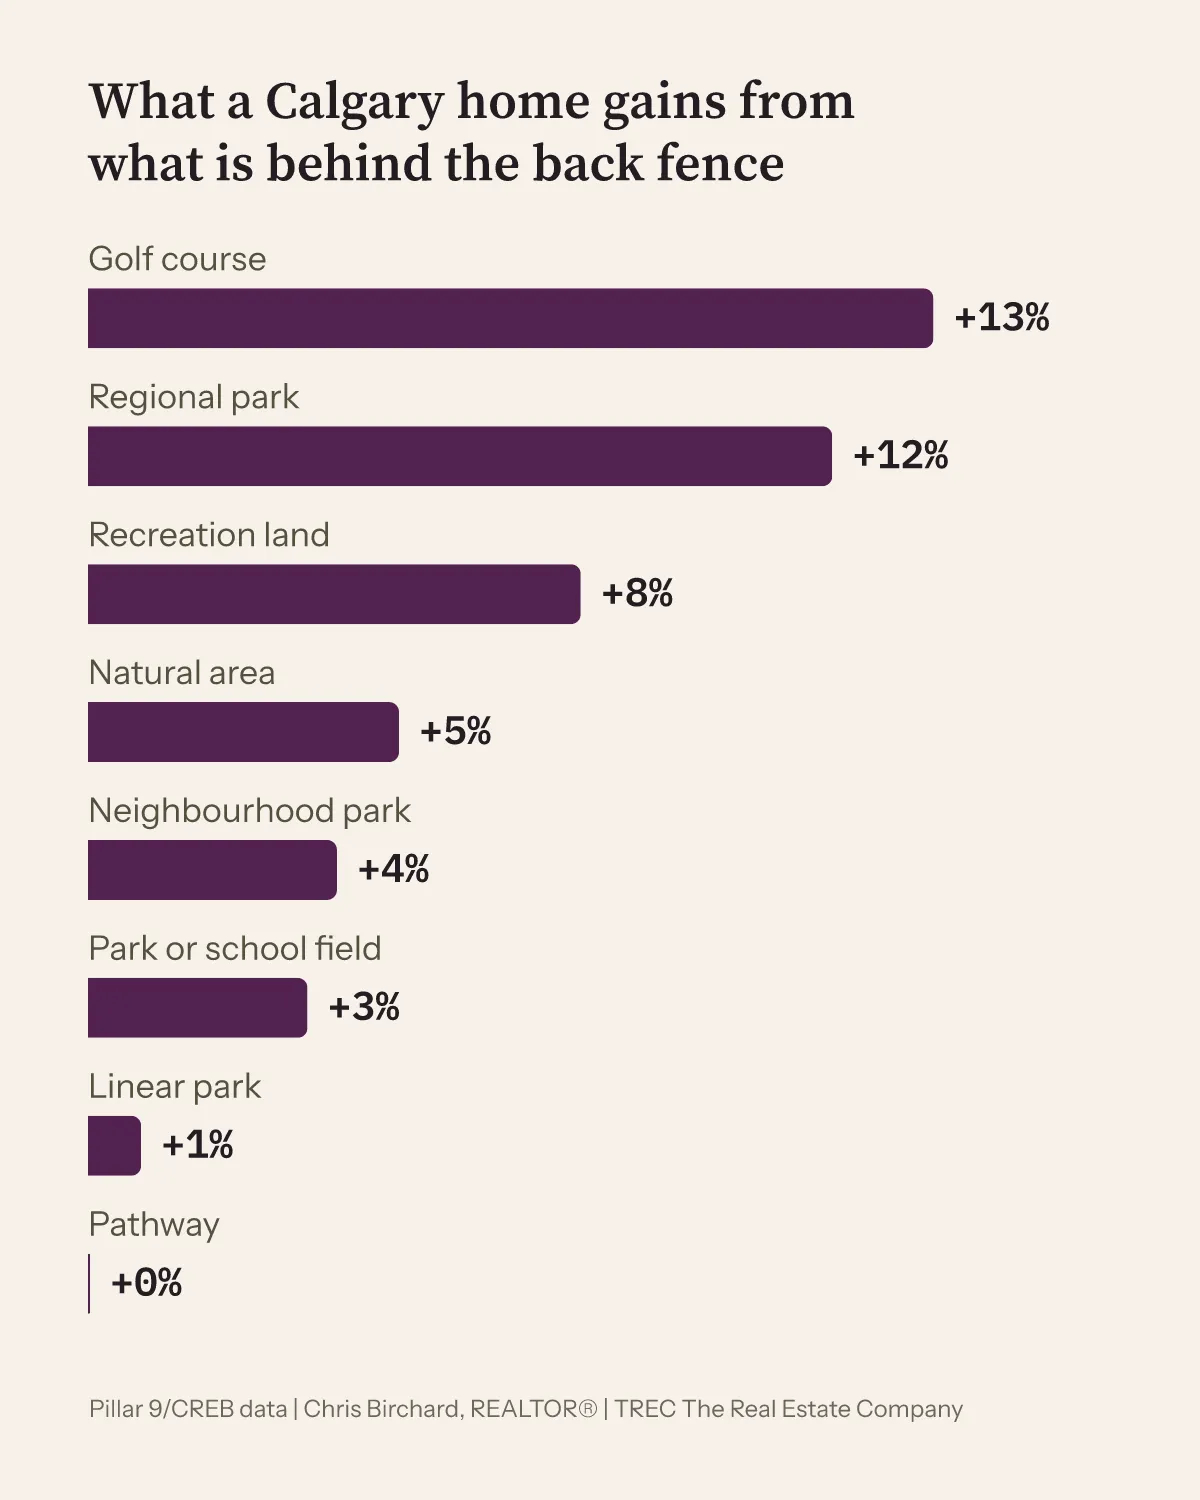
The numbers behind this chart
| Behind the back fence | vs an ordinary lot | Sales |
|---|---|---|
| Golf course | +13% | 266 |
| Regional park | +12% | 74 |
| Recreation land | +8% | 239 |
| Natural area | +5% | 276 |
| Neighbourhood park | +4% | 3,145 |
| Park or school field | +3% | 991 |
| Linear park | +1%, not a clear effect | 228 |
| Pathway | 0% | 436 |
| Undeveloped land | -1%, not a clear effect | 227 |
- Size does the work. A park under half a hectare added about 1%. A park of 10 hectares or more added about 6%, on 1,154 sales.
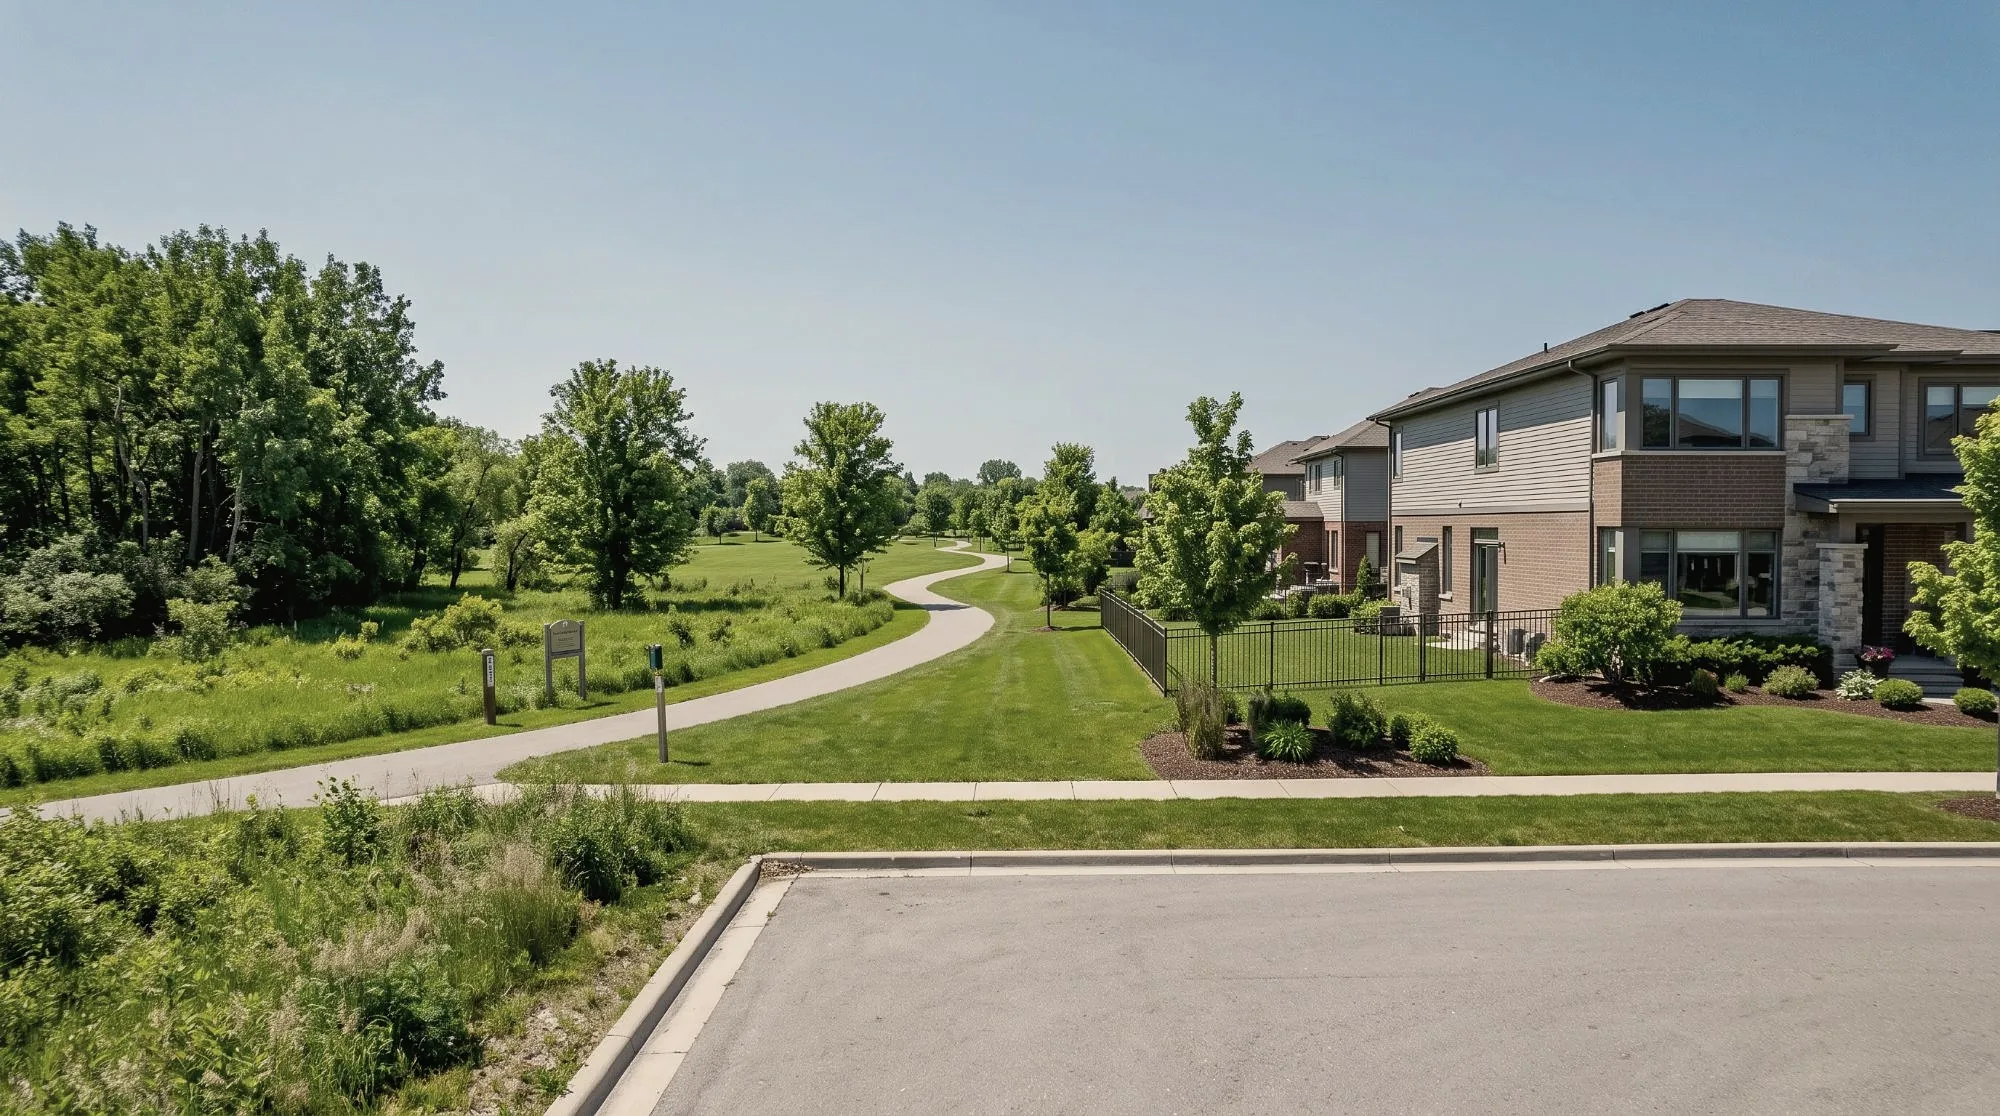
- A pathway is a strip between you and something else. The park past it gives, the road past it takes, and the path itself is neither. When a listing says “backs onto a pathway”, ask what is past the pathway.
- It pays more where homes cost more. About 5% in upper-price communities, about 2% in entry-price ones.
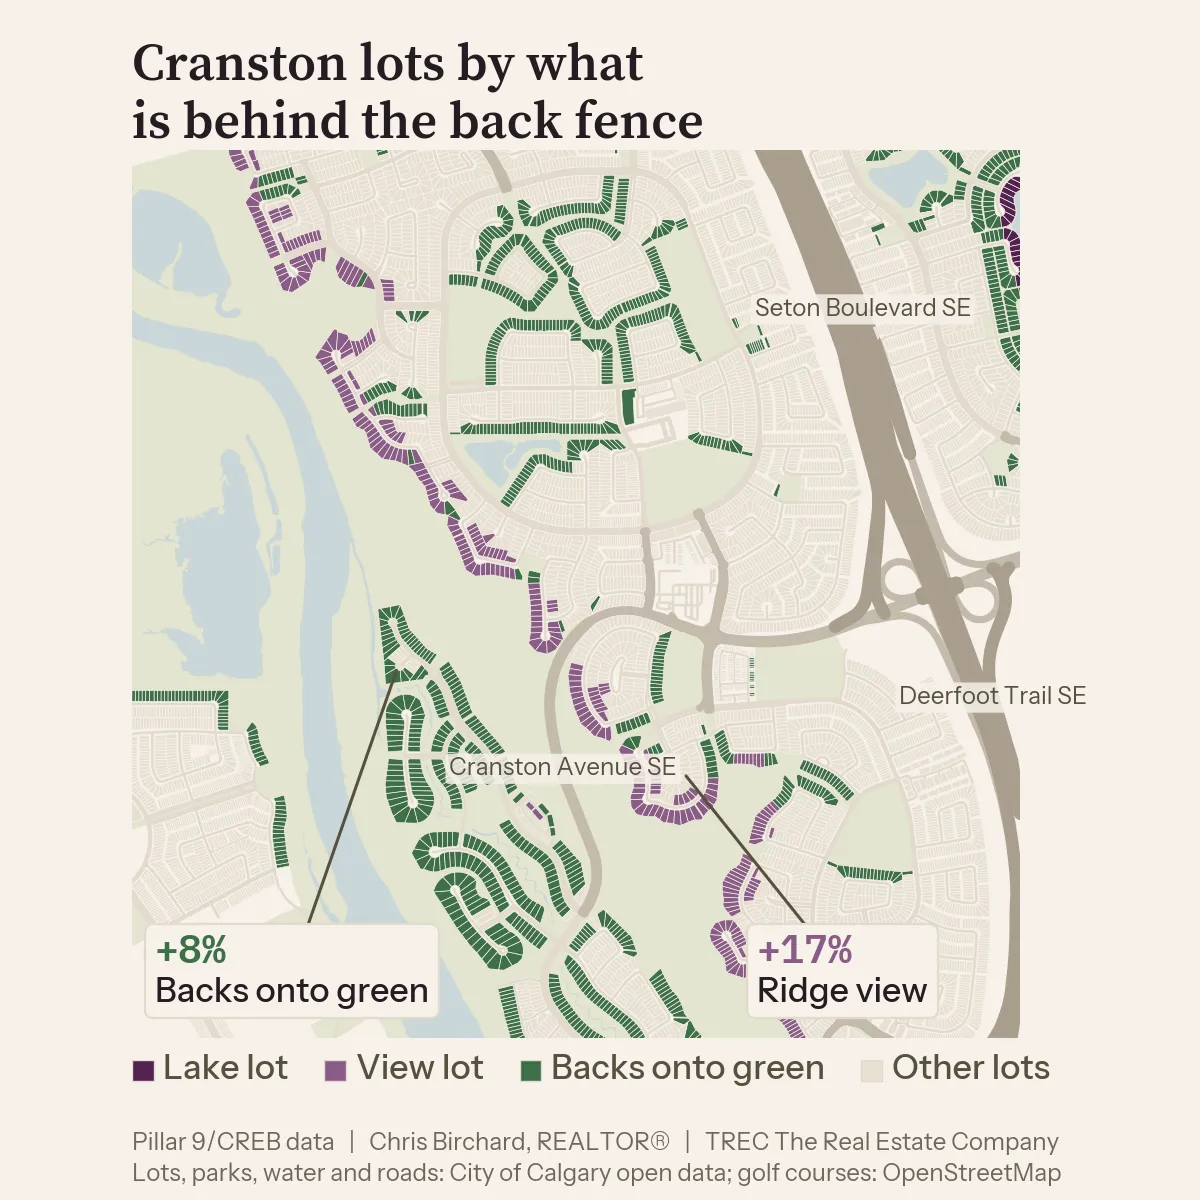
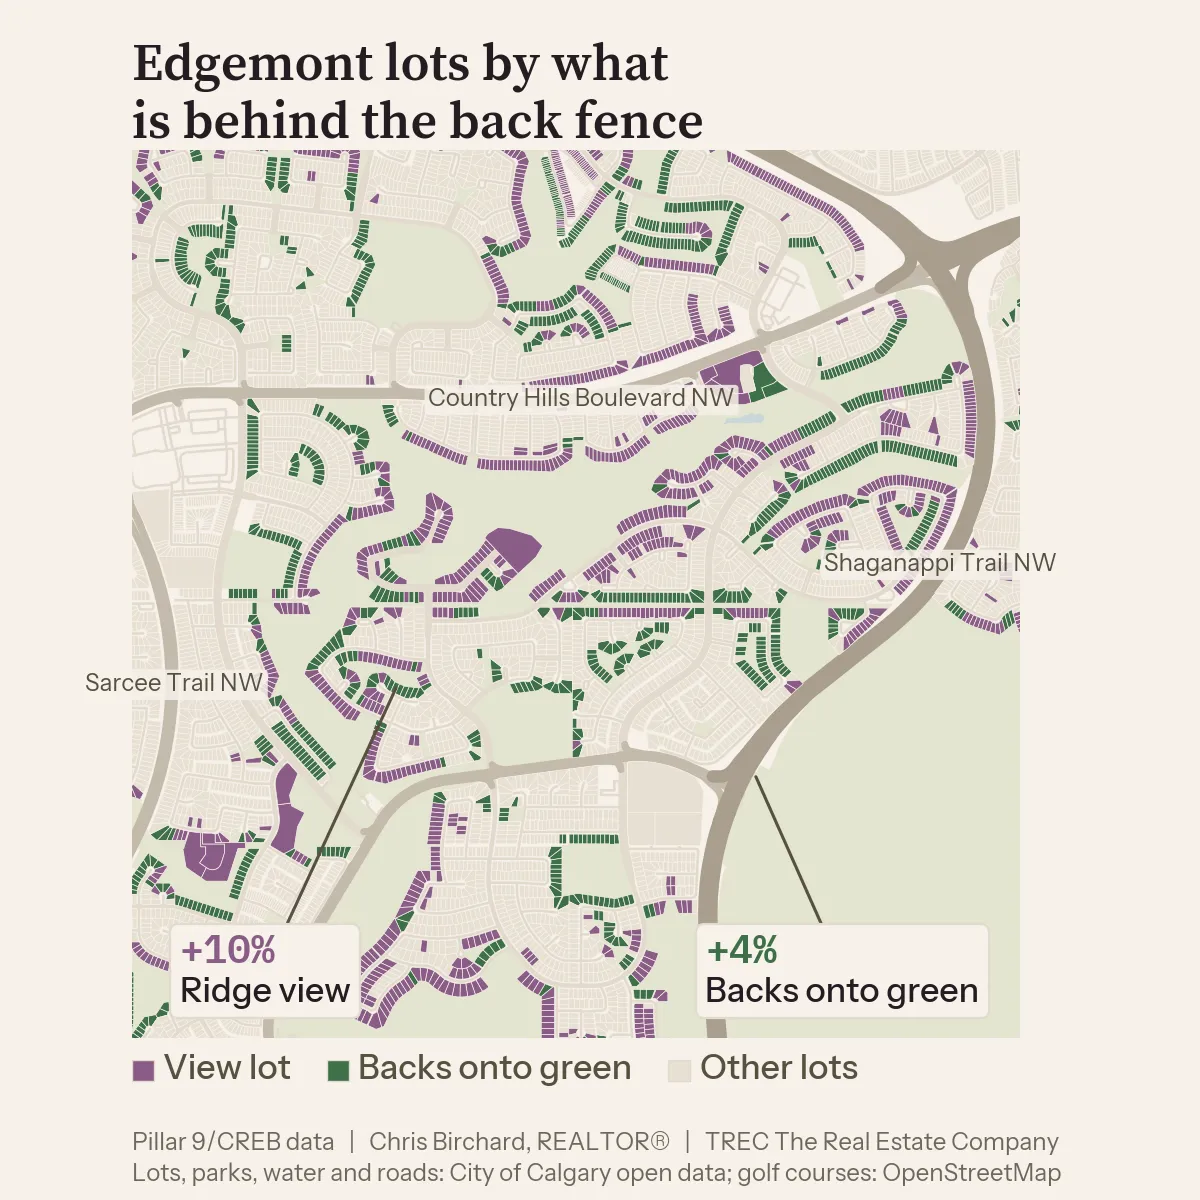
- Backing onto green space varies by community, from about 4% in Edgemont to about 11% in Mahogany, with Discovery Ridge, Aspen Woods and Cranston in between.
The numbers by community
| Backs onto green space | vs an ordinary lot | Sales |
|---|---|---|
| Mahogany | +11% | 136 |
| Discovery Ridge | +10% | 61 |
| Aspen Woods | +10% | 55 |
| Cranston | +8% | 215 |
| Edgemont | +4% | 89 |
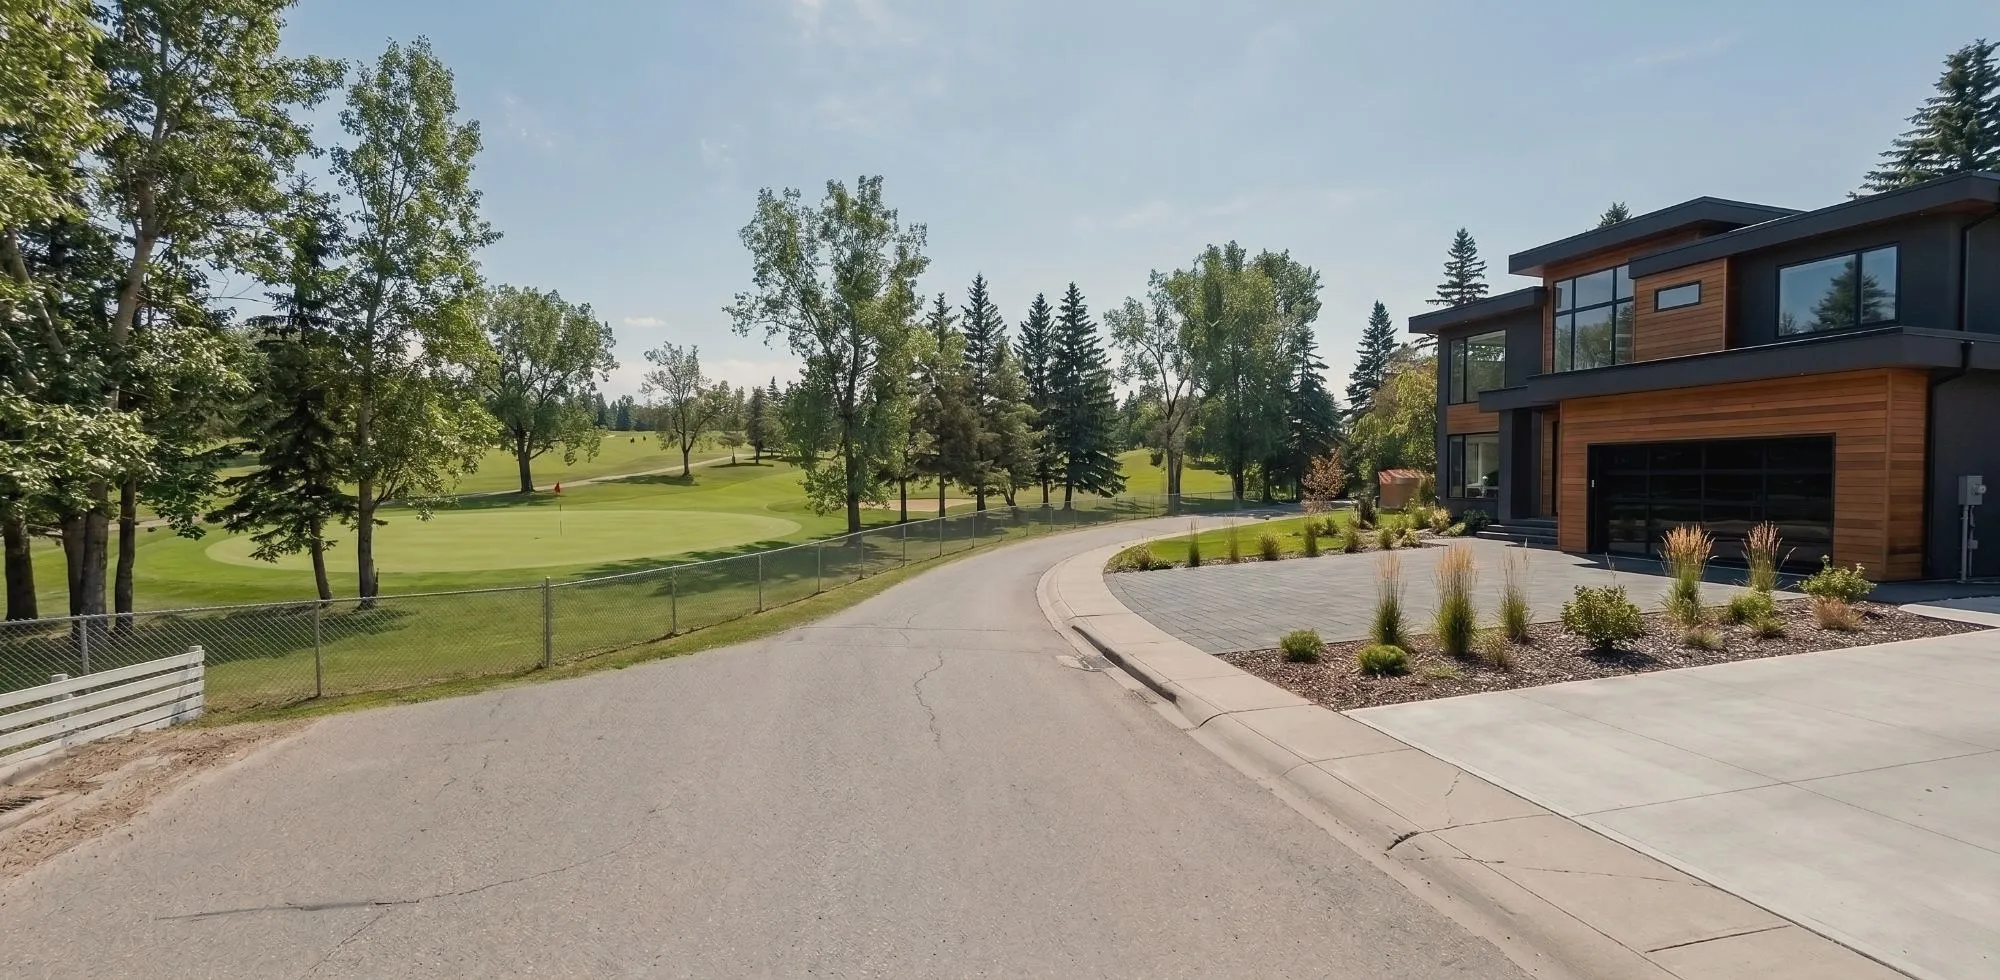
How much does a view add to a Calgary home?
A view adds 3% to 15%, and the number depends on one thing: how far the ground falls behind the house. The market prices the drop by the metre.
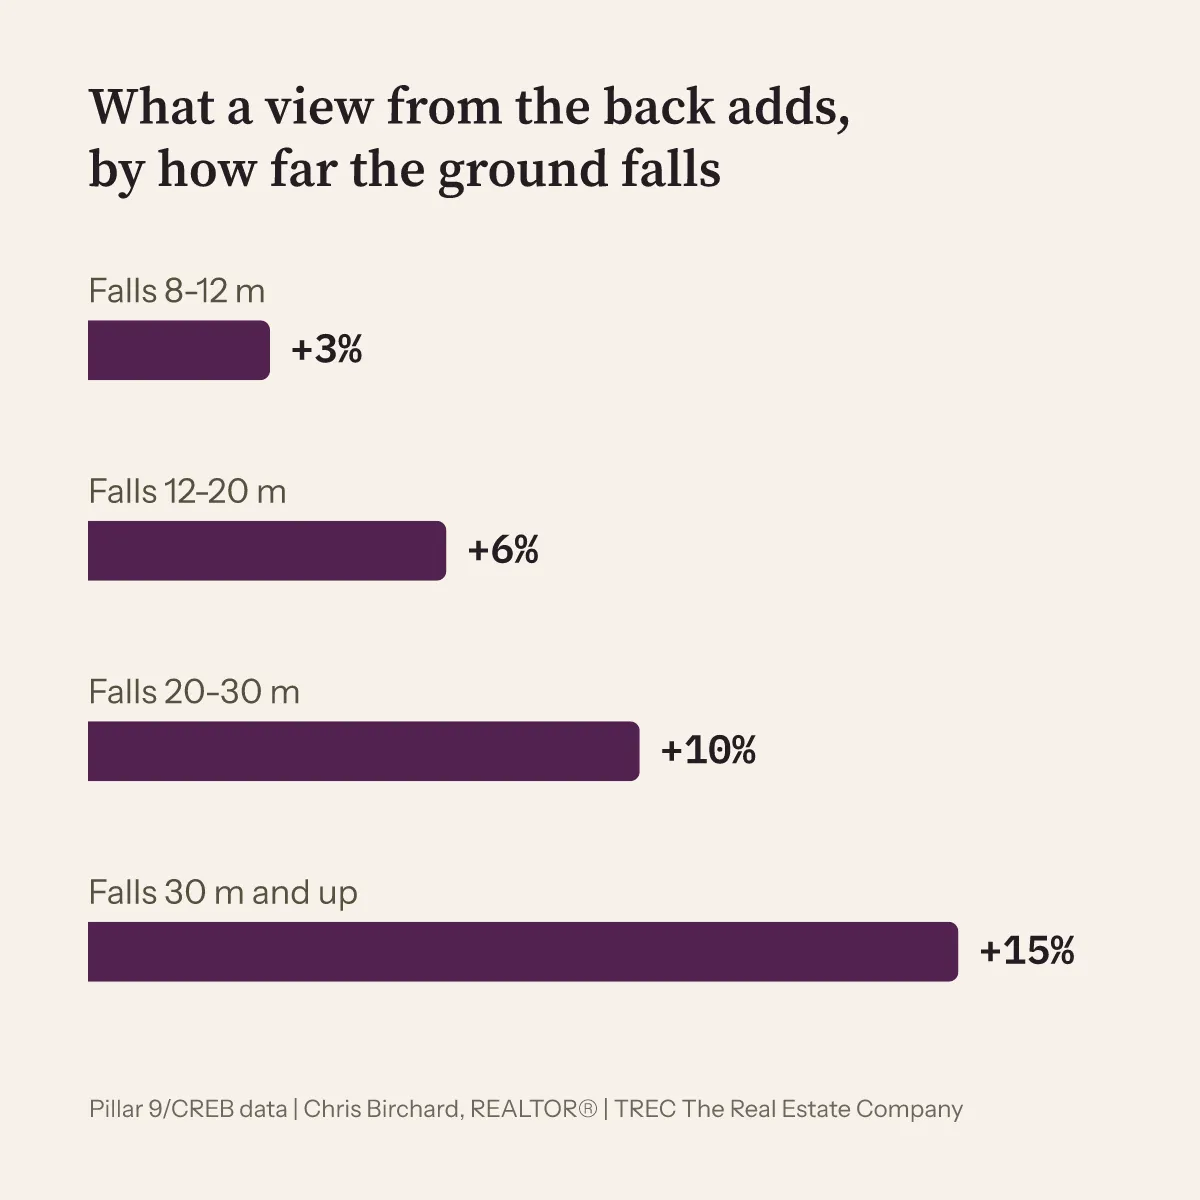
The numbers behind this chart
| The ground falls | View from the rear | Sales | View from the front | Sales |
|---|---|---|---|---|
| 8 to 12 m | +3% | 488 | -1%, few sales, not a clear effect | 6 |
| 12 to 20 m | +6% | 510 | +3% | 212 |
| 20 to 30 m | +10% | 288 | +9% | 236 |
| 30 m and up | +15% | 111 | +13% | 55 |
- The back deck wins below 20 metres. A view from the front window adds about 3% at a 12 to 20 metre drop (212 sales), then catches up: about 9% at 20 to 30 metres (236) and 13% at 30 metres and up (55).
- The view communities are the escarpments. View lots in Cranston, Evergreen and McKenzie Lake sold for about 17% to 19% more. In the northwest, with shorter drops, Edgemont and Tuscany about 10% to 11%.
- The ground model knows the land, not the trees. A 20 metre drop with a mature spruce in the way is a 20 metre drop on my map and a wall of green from the kitchen. The number is where I start; the showing decides.
The numbers by community
| View lots | vs an ordinary lot | Sales |
|---|---|---|
| McKenzie Lake | +19% | 35 |
| Evergreen | +17% | 39 |
| Cranston | +17% | 59 |
| Tuscany | +11% | 75 |
| Edgemont | +10% | 91 |
Two more that come up
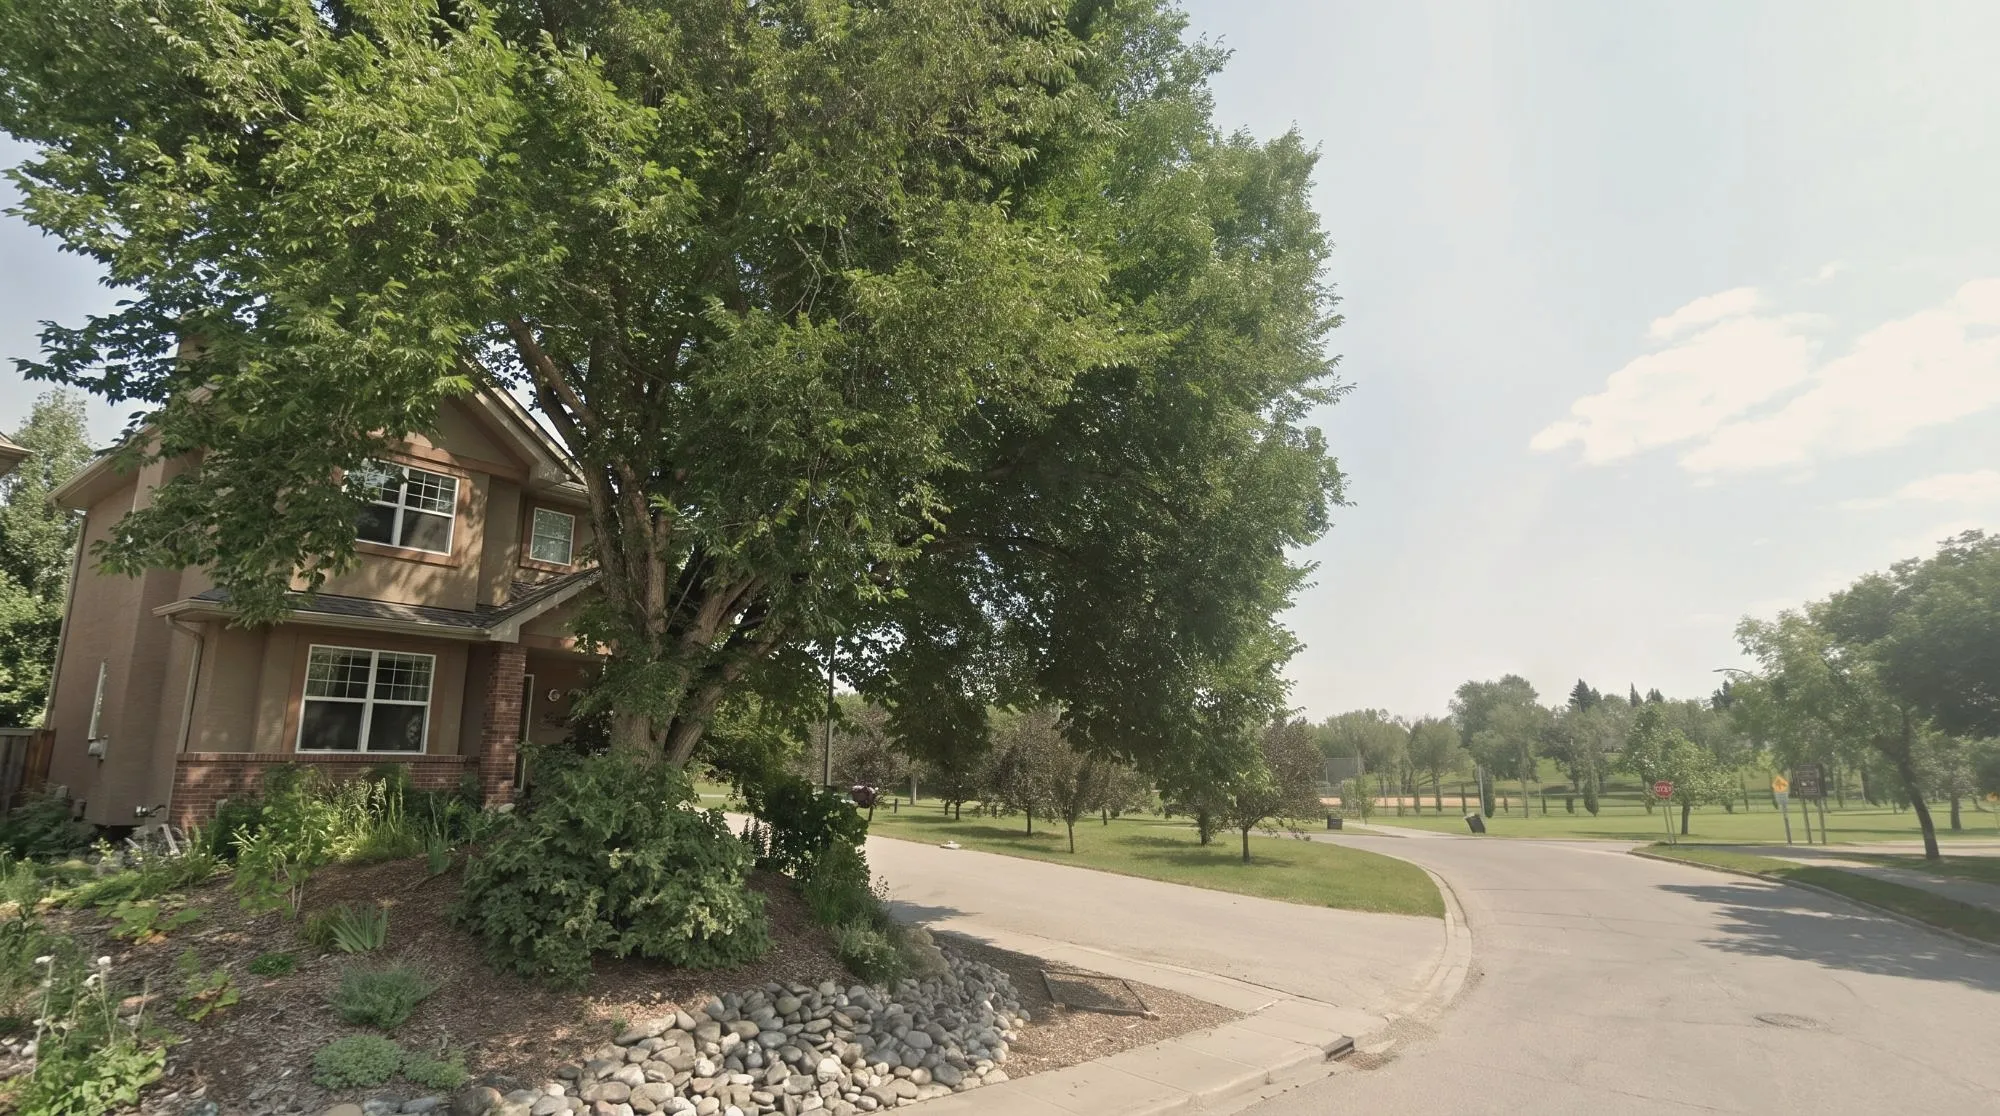
Across the street. Facing green space adds about 1.6%, on 3,897 sales. Facing a regional park about 8% (74 sales), a natural area about 7% (68). A park across the road is a view from the front window with no one parked in front of it.
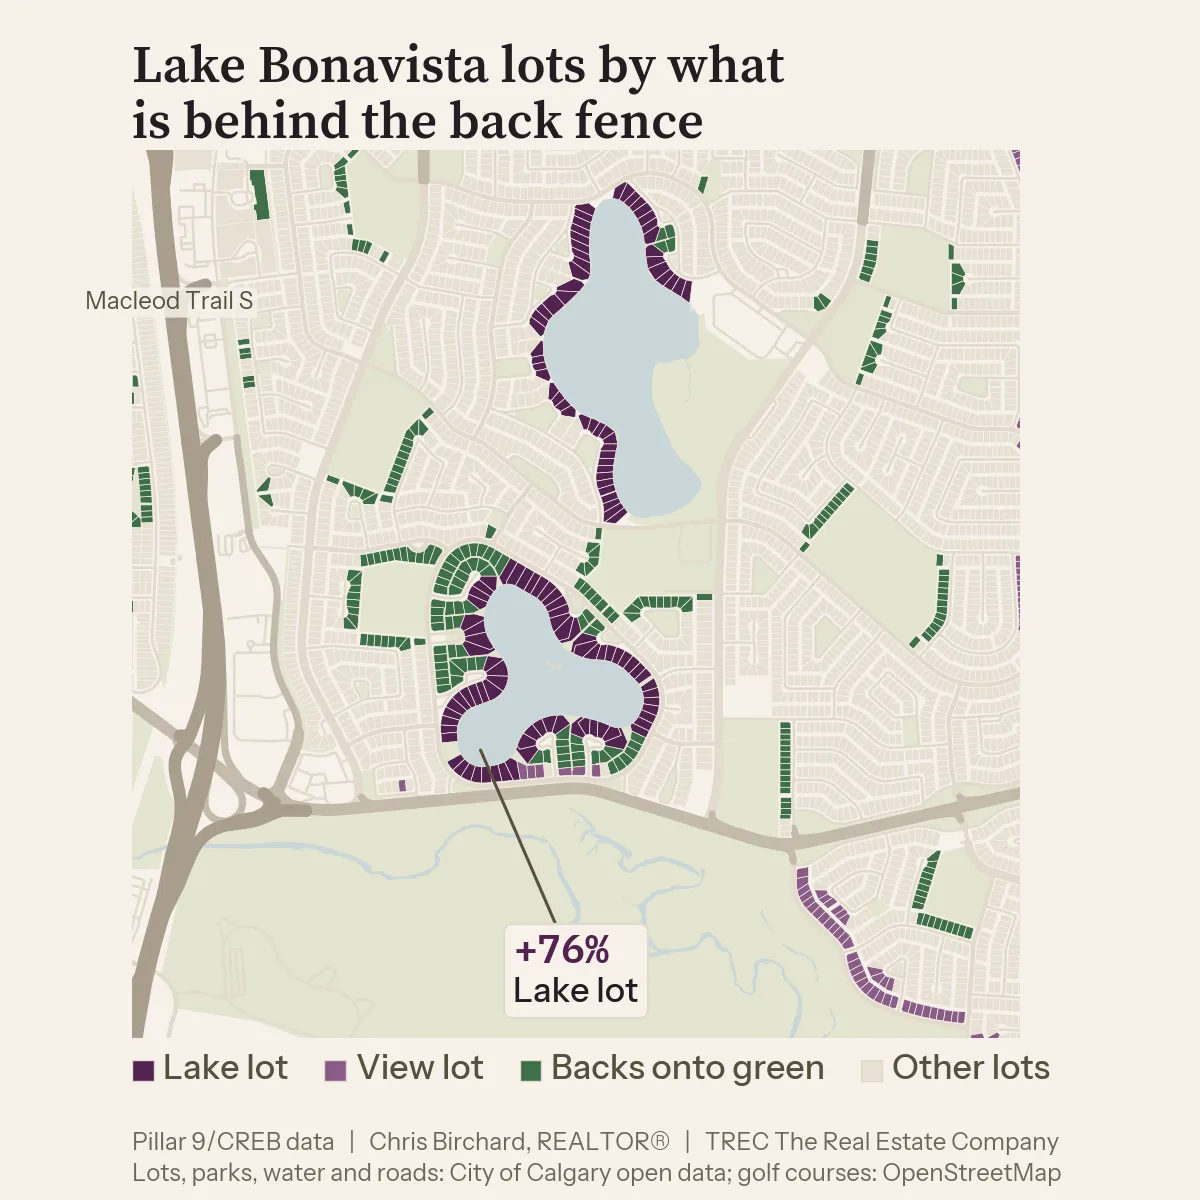
Lake and river. A lake lot sells for about 74% more, a river or creek lot about 32% more. By community the lake premium runs from about 62% in Sundance (10 sales) to about 80% in Chaparral (12), with Coral Springs the exception at about 19% on a smaller lake (8 sales). These rest on few sales. The caveat is the house: a home on the water is usually custom-built and finished to a different standard, so part of that premium is the house people build on a lake lot, not the water.
Does a good lot grow in value faster?
No. Repeat sales of the same homes, held two years or more, show view lots and park lots growing slightly slower than ordinary lots, about half a percent a year, and lake lots at the same rate. A premium paid once is mostly still there at the next sale. For a buyer that means the lot is not a bet. For a seller it means the premium has held through every year in the data.
What about road noise?
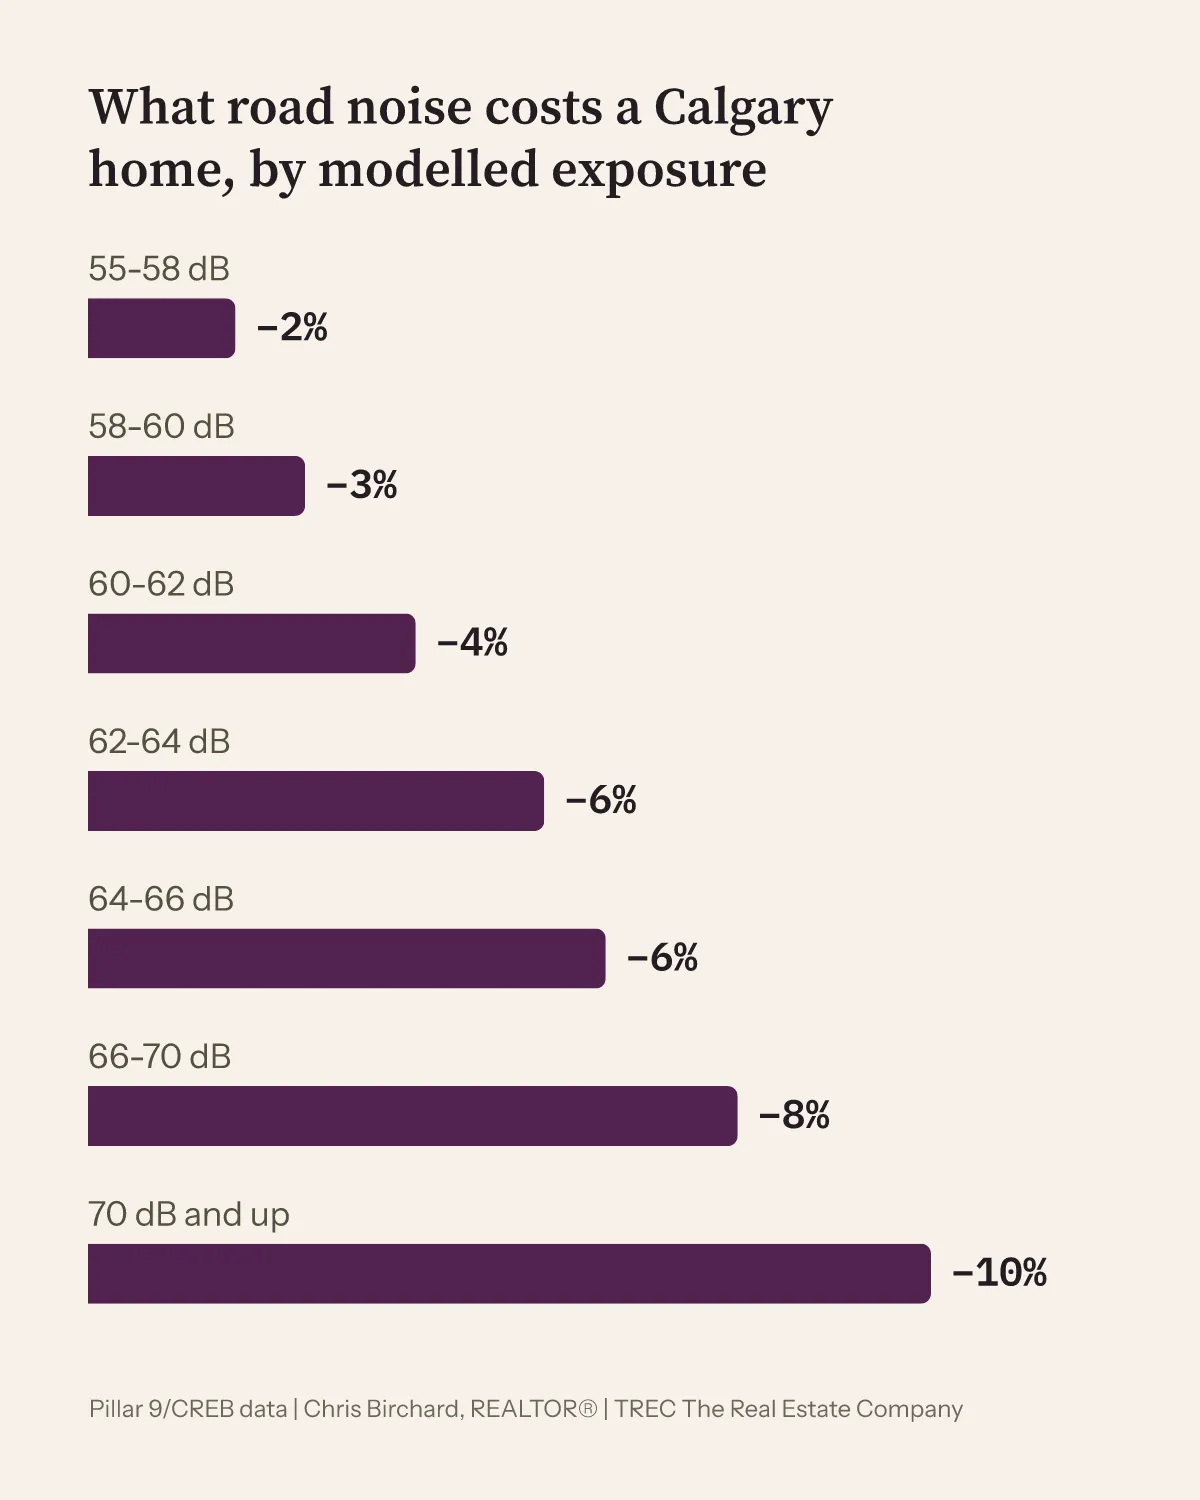
Road noise costs a Calgary home 2% to 10%, the market has priced it the same way for four years, and once you know the number it stops being a worry.
The numbers behind this chart
| Modelled road exposure | vs a quiet ordinary lot | Sales |
|---|---|---|
| 55 to 58 dB | -2% | 10,802 |
| 58 to 60 dB | -3% | 3,387 |
| 60 to 62 dB | -4% | 1,463 |
| 62 to 64 dB | -6% | 1,175 |
| 64 to 66 dB | -6% | 1,328 |
| 66 to 70 dB | -8% | 650 |
| 70 dB and up | -10% | 273 |
The number is a modelled exposure, without sound barriers, measured from every side of the lot: a home that hears a trail across a lane counts the same as one with the road straight behind it. Two findings make it useful rather than alarming.
- It is steady. About 5% every year since 2022 for lots at 60 dB and up.
- The market reads the road, not the wall. Lots behind the sound walls OpenStreetMap has mapped sold for no more than lots without one at the same modelled exposure.
To a buyer: a home that hears the road at 60 dB or more sells for about 5% less than the same home on a quiet street, and the repeat sales show that gap is still there when it sells again. The buyers who took it got more house for the same money and gave none of the discount back.
To a seller: the market priced the road in years ago, and the discount has been about the same every year since 2022. A home priced with the road in sells like any other home. Priced as if the road were not there, it waits, and the market takes the discount anyway.
How I use this on one home
Here is the method on one lot, a view lot in Edgemont.
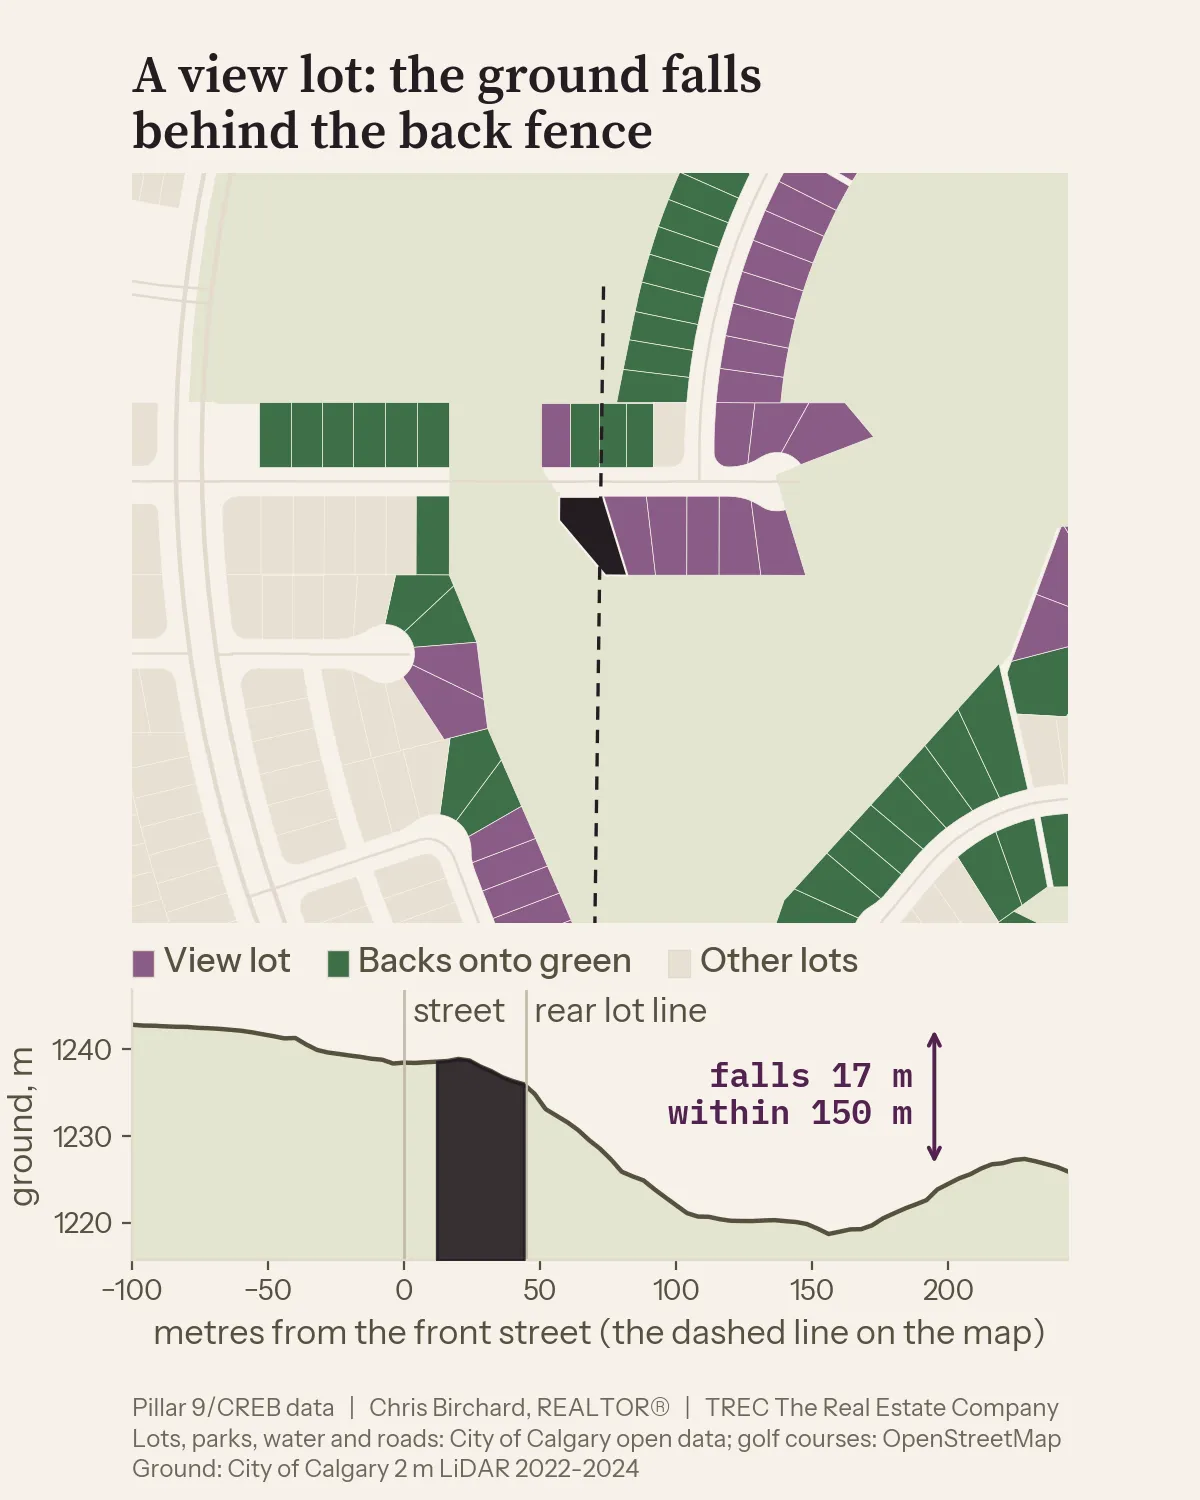
- Read the lot. The ground falls 17 metres within 150 metres of the rear lot line, over park land. Modelled road exposure is quiet. A view lot that also backs onto a park, and both go into the price.
- Pick the same kind of comparables. Other Edgemont view lots, same style, similar size, last three years. When there are enough, the price per square foot comes from those sales alone and the view is already inside the number.
- Apply the premium. Edgemont view lots sold for about 10% more across 91 sales; a 12 to 20 metre drop citywide runs about 6%; green space behind in Edgemont about 4%. So the view is worth about 6% to 10% on top of the same house on an ordinary Edgemont street, with the park on top of that.
- Give three prices, not one. As it sits, updated, renovated, with the lot premium riding along with each. A buyer decides what the view is worth to them before deciding what to offer. A seller sees how much of the asking price is the house and how much is the ground.
Questions people ask
How much does backing onto a park add to a house price in Calgary? About 4% for a neighbourhood park, on 3,145 sales from October 2022 to October 2026. A golf course behind the fence adds about 13%, a regional park about 12%, a natural area about 5%, and a pathway on its own adds nothing.
Is a view lot worth more in Calgary? Yes, by the metre of drop. A view from the rear adds about 3% where the ground falls 8 to 12 metres behind the house, about 6% at 12 to 20 metres, about 10% at 20 to 30 metres and about 15% at 30 metres or more.
Does a park across the street add value? About 1.6% for green space of any kind across the street, on 3,897 sales, and about 1% for a neighbourhood park, or a park or school field. Facing a regional park added about 8% and facing a natural area about 7%.
How much does road noise lower a home’s value? About 2% at a modelled exposure of 55 to 58 dB, rising to about 10% at 70 dB and up. The discount has been about 5% every year since 2022, and homes behind the sound walls OpenStreetMap has mapped sold for no more than homes without them at the same modelled exposure.
Do view and park lots appreciate faster? No. Repeat sales of the same homes show view and park lots growing slightly slower than ordinary lots, about half a percent a year, and lake lots at the same rate. A premium paid once is mostly still there at the next sale.
How much more is a lake lot worth in Calgary? About 74% more than the same home on an ordinary lot in the same community, on 86 sales, from about 62% in Sundance (10 sales) to about 80% in Chaparral (12). Part of that is the custom home people build on a lake lot, not the water.
How do you know what is behind a specific house? Every Calgary lot is matched to the City’s open data for water, parks, pathways, streets, rail and the ground model, and every sale is pinned to its lot. For your own home, send me the address and I will send you the read for your lot.
How it was built
For the readers who want the method. Everything here runs on public data plus Pillar 9 / CREB sales records, as of 8 October 2026.
The lots. Every residential lot in Calgary, 391,024 of them, from the City’s assessment parcel layer: outline, address, lot size and community. The assessed value is not used. Water comes from the hydrology layer (a lake is a named water body or 5 hectares and up, a pond is 0.3 to 5 hectares), parks from the parks layer, open space from the land-use districts (natural areas, parks and school fields, recreation land, undeveloped land), golf courses from OpenStreetMap (data (c) OpenStreetMap contributors, under the ODbL), pathways, street centrelines with their road classes, rail and LRT lines, and the airport noise contours.
What is behind the fence. The front of a lot is the street in its address, at the nearest point. The rear lot line is the far edge on the line from that street through the lot’s centre. Two probes, 4 and 12 metres past the rear line, find what is there: water, green space, a pathway, a lane, a street by class, a neighbour’s lot or a non-residential lot. A third probe 14 metres past the front street finds what the house faces. Anything within 6 metres of any lot line counts as beside the lot. A corner lot has two differently named streets within 10 metres.
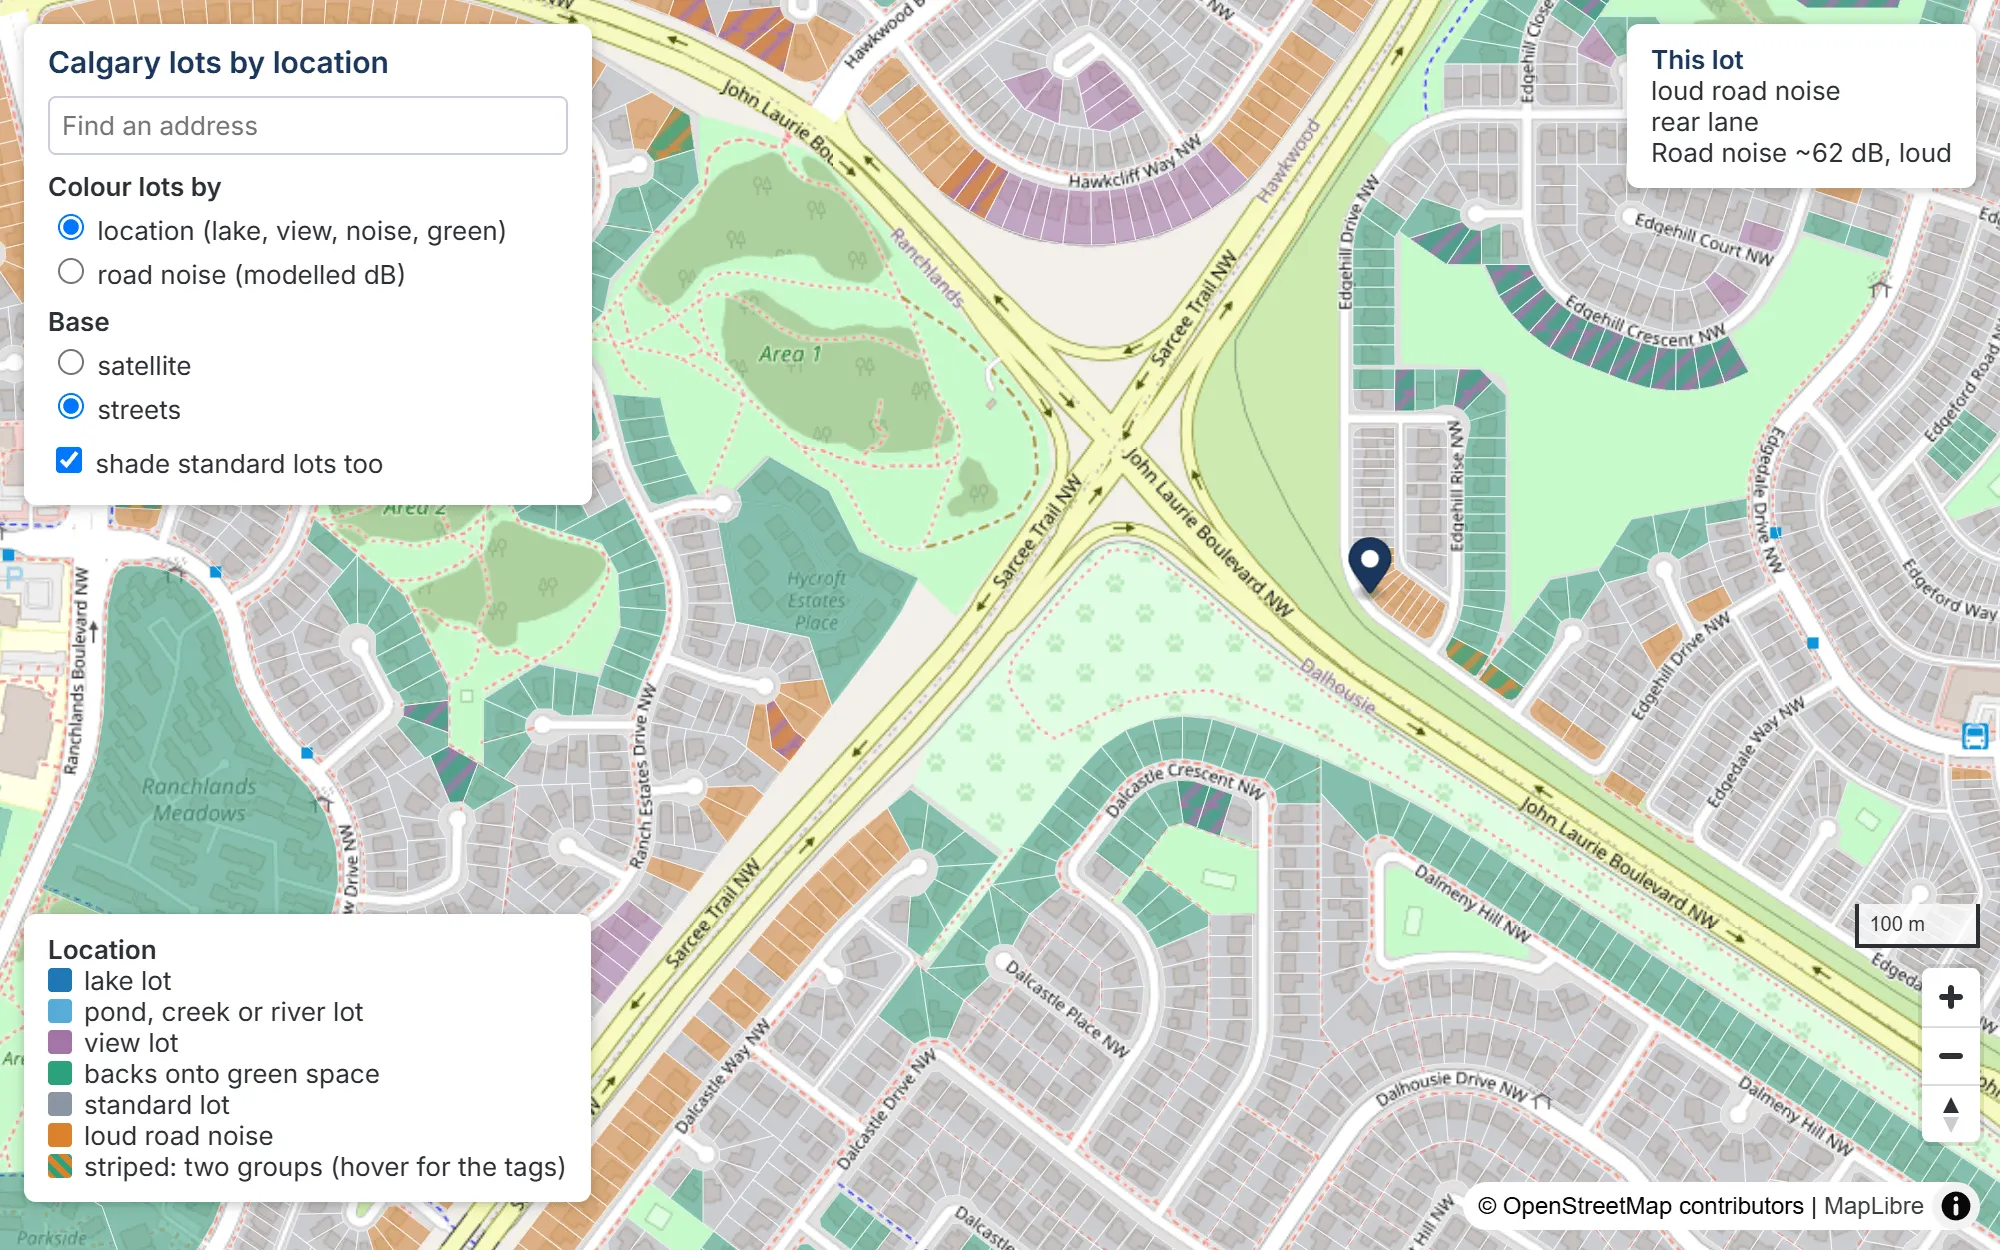
The result of all that is a working map of every lot in the city, and this is a screen from it. Each lot carries its tag line: what is behind the fence, how far the ground falls, and the modelled road exposure.
Views. The ground is the City’s 2 metre LiDAR model, flown 2022 to 2024. A lot is a view lot when the ground falls at least 8 metres within 150 metres past the rear line over open ground, or 16 metres when a neighbour’s lot is behind, or 12 metres past the front street (20 with a house across it). The fall is measured on the bare ground, so trees and houses are not in it.
Road noise. A screening model in the shape of the UK’s CRTN method, the standard simplified road-traffic calculation. The source level at each road is set from the City’s 2024 daily traffic count, the posted speed and the heavy-vehicle share, on the freeway and major arterial network; other roads take a typical volume for their class. The path from each side of the lot to the nearest freeway, arterial, collector and the lot’s own street carries distance, soft-ground attenuation, berms and road cuts from the LiDAR, and the rows of houses in between (6 dB for the first row, 3 dB for each after). The roads are summed in energy to one level per lot. The City’s data has no sound walls and the bare-earth LiDAR removes them, so the level is exposure without barriers. OpenStreetMap maps about 42 kilometres of noise barriers in Calgary, covering about 6% of the road-noise lots; the lots behind them sold for no more than unwalled lots at the same modelled level, so the walls stay out of the model. The road-noise group starts at 60 dB, or a heavy-rail line within 50 metres.
Pinning sales to lots. 99.3% of Calgary home sales land on a lot, by address first, then by the listing’s coordinate inside a lot, then the nearest lot within 25 metres. Where a listing carries an address, the coordinate falls on the same lot as the address 96.9% of the time (17,020 checked).
Pricing the features. The sample is 55,493 detached and semi-detached sales from October 2022 to October 2026, single-title lots, $150,000 to $6 million, 500 to 6,000 square feet, in communities with 20 or more sales. The model is a regression of the log of the sale price on the log of living area, the log of lot size, age and age squared, style, basement finish, walkout, suite, garage stalls, full baths, bedrooms above grade, finished area below grade, corner, the month of sale, and a fixed effect for each community in each year, which is what makes every premium “against the same home in the same community in the same year”. Each lot feature is one term, so a lot that backs onto a natural area with a view carries both effects. Standard errors are clustered by community. A 10% bigger home sells for about 4% more, all else equal, and the model explains 76% of the within-community variation in price (74% without the lot terms).
Two checks on every number. The same regression with a 500 metre grid square by year in place of the community by year, so a loud edge is priced against its own quiet interior; it runs a point or two smaller at the loud end and is the conservative figure. And a same-street match: each featured sale against the median of quiet, ordinary-lot sales within 300 metres, same type and style, sold within 9 months, size within 20%, built within 12 years, at least 3 of them. The match exists for about a third of road-noise and park sales, a fifth of view sales, and almost no lake sales, and it skews to the ordinary ones, so it is a floor rather than a rival estimate.
Limits. Renovation and condition are not in the data, so part of any premium is the nicer house people build on the nicer lot. A mis-tagged lot pulls every effect toward zero, so the true effects are, if anything, slightly larger. The noise level is a rank within a community, not a meter reading: quote the price gradient, then walk the yard at rush hour. Lake and water premiums rest on 86 lake and 44 river or creek sales over four years, 8 to 15 per lake community, and are read with the community’s own sales. No figure is published from fewer than 5 sales.